|
We are living in uncertain times. That’s always true to a certain extent, but right now with the Corona virus pandemic it’s more extensive than we’re used to. Governors are running scenarios to determine what is the best way to slow the spread of the disease while not choking off all economic activity. All businesses are under strain as people stay at home and non-essential businesses are closed. What should you do for your business?
I’d suggest that you copy what the Governors are doing. Run scenarios to determine what the dangers are. Use a model and adjust that to fit events as they happen. I’m going to give you some ideas on how to set that up. It’s a bit of work to set up, but once it’s in place it will be easy to update for changes. You don’t have time to install planning software and you certainly don’t have time to learn how to use a new system. I say use your current spreadsheet software, Excel or something similar. I’ll be using Excel when I talk about things you can do in your spreadsheet. Your first step is to create a baseline projection. Take your last twelve months so you get annual numbers. We’ll use that as your base. Get those numbers into a spreadsheet. You can put them in as the line items that show up on your financial statements or you can go detailed and put them in from your trial balance that lists all your general ledger accounts. Now take those numbers and spread them out over the number of periods you want to project. If you want a one-year projection by month you can divide everything by 12 and spread it out over 12 columns in the spreadsheet. This can be your baseline. In fact, to make it easier you can call this tab on your spreadsheet “Baseline”. Now you’ll want to set up some tabs on your spreadsheet that refer to your baseline numbers to build the reports you want to see. You can name these tabs with the report name but be sure to also include “Baseline” in the name. Next, you’ll want an area where you’ll be able to make changes and play with different scenarios. You’ll want this to be in the same format as your baseline tab. The easiest way to do that is to simply copy your baseline tab and rename it. In Excel you can hold down the Ctrl key and then click and hold your mouse on the baseline tab. Now still holding the mouse button down drag to where you want the new tab to go then let go with your mouse. A copy of the baseline tab should appear. Rename it as “Scenarios” Then go into that tab and erase all your baseline numbers leaving the titles in place. You can now put in different scenarios, or what if’s if you prefer and it will be in the same format as your baseline data. My suggestion for how to use the Scenarios tab is that you set up separate tabs where you calculate the different impacts of your scenario and have the Scenario tab pull in the numbers from your calculation tabs. The numbers you put in here are the change from the baseline. So, for example, if your sales were $100,000 and the scenario had them fall to $75,000 the entry in the scenario spreadsheet would be for ($25,000) and not $75,000. Once you have this built out, you’ll need a way to get your final numbers. That is fairly simple to do. Using the same technique as before, create a copy of the Baseline tab and change the name of this one to “Combined”. Once again, erase all the data leaving the titles in place. Now choose your first cell that would have numbers in it. Set up a formula to add the same cell from the Baseline tab and the Scenario tab. This will give you the combined number of your two tabs. You can copy this formula to all your cells with data and suddenly you have all your numbers. You can now create reports to show the results of your scenarios. That sounds like a lot of work to create those reports again doesn’t it. There is a way to make it easier. For the reports you set up earlier with the baseline copy each tab and rename it. Now you can use the replace function to get this new report to point at the Combined tab instead of the Baseline tab. In Excel you can find this function on the Home ribbon under Find & Select. When the function opens up, you’ll be asked to put in “Find what:” and “Replace with:”. You’ll want to replace all the references to the Baseline tab to the Combined tab. In formulas that refer to other tabs the tab name is in single quotes. We’ll use that, so you can put ‘Baseline’ in the Find what box and ‘Combined’ in the Replace with box. Then click the Replace All button at the bottom. Presto, your report now pulls all it’s numbers from the Combined tab. You can now see the results from your scenario. You can also use this technique to generate reports that show just the changes made from your scenarios by changing the references to ‘Scenarios’. This would help you to be able to explain the changes from the scenarios. Hopefully, this brief overview gives you enough of a picture to develop your own tool to be able to try to figure out some of the uncertainties facing you. Stay healthy.
1 Comment
Part One of this series was an introduction to breakeven analysis. It defined what breakeven analysis is and gave a quick example of how it is calculated. This part will talk more about the calculation and using it to analyze a business. Let’s set up an income statement for a sample manufacturing company and then use them to calculate the company’s breakeven amount. 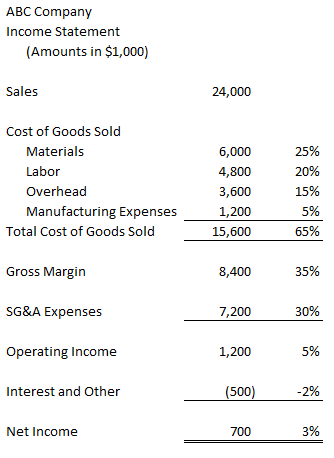 Looking at this we can calculate a breakeven number for the company. The first step is to determine the variable margin, which in sales less the variable costs. The variable costs would be those that vary up and down with sales, the column on the right that is each line’s percent of sales would stay the same for variable costs. In this sample the variable costs would be Materials and Labor. So, the variable margin would be $13,200 [24,000 sales less 6,000 materials and less 4,800 labor]. The variable margin percentage would be 55% [13,200 variable margin divided by 24,000 in sales].
The next step would be to add all the fixed costs up. The total fixed costs are $12,500 [3,600 Overhead + 1,200 Mfg Expenses + 7,200 SG&A Expenses + 500 Interest and Other]. From our calculations above we know that each dollar in sales results in 55 cents of variable margin. We now have all the elements for the breakeven calculation. Breakeven is equal to Fixed Costs divided by the Variable Margin. So, our breakeven would be $22,727 [12,500 divided by 0.55]. And what do we do with this number? Read on. Now that you know the breakeven numbers you can use this as a diagnostic tool for quickly analyzing financial statements. For our example, say the next period’s income statement shows sales of $20,000 and a loss of $1,500. You can easily see that because sales were less than the breakeven number, we didn’t have enough sales to cover our fixed costs. What if sales were over breakeven, but we still had a loss. You can check the components of your breakeven calculation for the period to see what’s off. Is the variable margin lower? Are the fixed costs higher? Looking at it this way, you’ll be able to easily know what to focus on so you can explain the financial results. My next post in this series will focus on using breakeven analysis in a more focused way. I’m going to do a series of posts on breakeven analysis. This is an underutilized tool you can use in a variety of ways. This first post will be an introduction to breakeven analysis. Future posts will discuss how to calculate it and different ways it can be used.
Breakeven analysis involves finding the point where the net profit for something is zero. So, when there’s no profit you’re just breaking even. It is an easy concept to explain to non-financial people. They can understand the concept of it even if they don’t understand the actual calculation. I’ve been in meetings where I’ve presented a breakeven analysis to a group of non-financial people and you would have thought I had just invented sliced bread from their reactions. The calculation looks at what items are variable, that is they fluctuate based on the number of units involved, and items that are fixed, they stay the same regardless of volume. For example, let’s say a company was considering purchasing some equipment but was unsure if the investment would be worthwhile. You know that the cost of the equipment is $25,000. That is a fixed cost; it won’t change based on the number of parts sold. The equipment will allow the company to manufacture parts that will cost $5 less than with the old equipment. That is a variable cost; it changes as the number of parts sold changes. So, the breakeven number of parts the company needs to sell would be 5,000. This is calculated by dividing the fixed costs of $25,000 by the variable component of $5 per unit. (25,000 divided by 5 equals 5,000.) Then you can compare that to the actual number of the parts sold in the past to see if 5,000 is a reasonable number. Think of what the reaction would be if instead of a discussing payback periods and return on investments with non-financial managers, you say we need to sell 5,000 parts to cover the cost of the equipment and in the past year we sold 12,000 parts. That was just a simplified breakeven analysis, but you can see that this can be a powerful tool for communicating the financial picture. I’ve spent some time in my last posts showing you how to use Excel to work with data; filtering it and converting text files to a format usable to Excel. What’s the value of that?
The value is that your data can tell you a story if you can work with it. Excel (or the spreadsheet software you use) is your best tool for ad hoc analysis of your data. You can’t predict everything you’re going to need to analyze and how you’ll want to show it. So, you need something that is extremely flexible. Excel fits that and you already know how to use it. You’ve heard the expression, “can’t see the forest for the trees.” In a work setting the impact of that translates to the people doing the work aren’t good at seeing trends and patterns. On the other end of the scale is the executive who boasts about flying at 30,000 feet to manage the business. Translated that means they’re not into details. There is a lot of room between the worker who can see that the trees he can see are good or bad and the executive looking out the plane window and seeing a forest below. Using the data allows you to target what you look at. To stick with the metaphor, you can look at the forest from 30,000 feet then dive to 5,000 to see how healthy the forest is. You can zoom to areas that look bad perhaps even flying at tree top level. I’ll give you a couple examples of when I was able to use data in this way. I worked at a manufacturing company. One of our customers set up a supplier summit; they invited all their vendors to come for a presentation. Prior to that I analyzed the customer. I had put all sales history into data I could work with. The sales history had customers and part numbers along with the sales and associated costs. Looking at the data made me do some more digging into the customer’s parts because the profit was very low. The customer was ordering parts in small batches but needed us to have any of the parts they might order available at any time. This caused us to keep large amounts of inventory. Looking at all of this and the extra costs incurred from meant that we were not making any money on this customer. At the supplier summit the customer said they were requiring all their vendors to give them a 30% price cut. We said no. Even though we lost the customer, we were better off. Later at the same company we were told by operations that another customer was bad. They were too much trouble for the amount of money we made on them. Looking at the data showed a very profitable customer, even with the extra costs for their requirements. I wanted to present this in an easily understandable way. I chose to use our financial statement that everyone was used to reading. Using the P&L as a template I put our results from the last 12 months in the first column. In the second column I put the sales and costs from this customer. Finally, the third column showed where we would be without that customer. Using a report that people were familiar with allowed us to focus on the results and not on how to read the report. That third column looked pretty awful and we stopped hearing suggestions that we should drop the customer. If you can get the data and work with it, you can look at all the trees in the forest and see the ones you need to see. Because successful companies know they profit and where they lose. |
 RSS Feed